computational fluid dynamics

Ascending through descending aorta, with and without a stent

A CFD comparison of healthy vs. stented aortic flow — how effective are stents at restoring healthy hemodynamics, and where does the model itself deserve a second look?

Clinical question

How effective are stents at restoring healthy aortic flow?

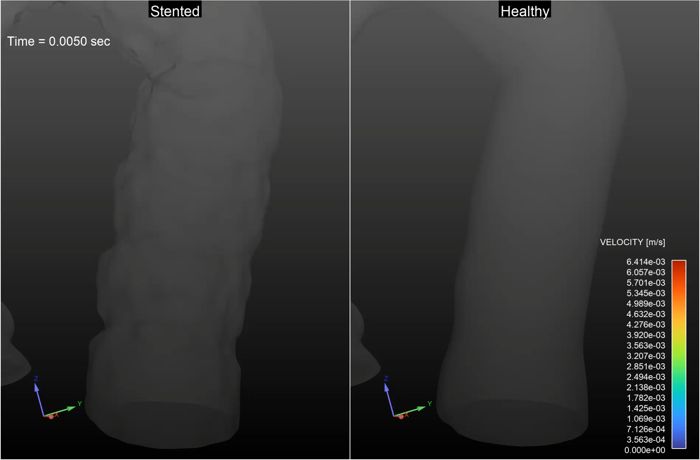
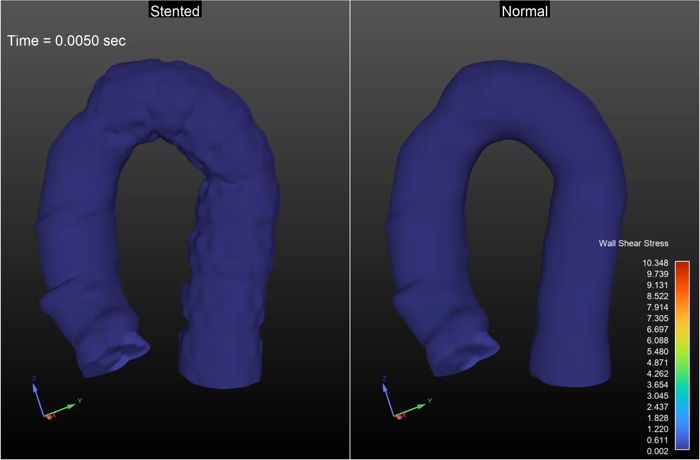
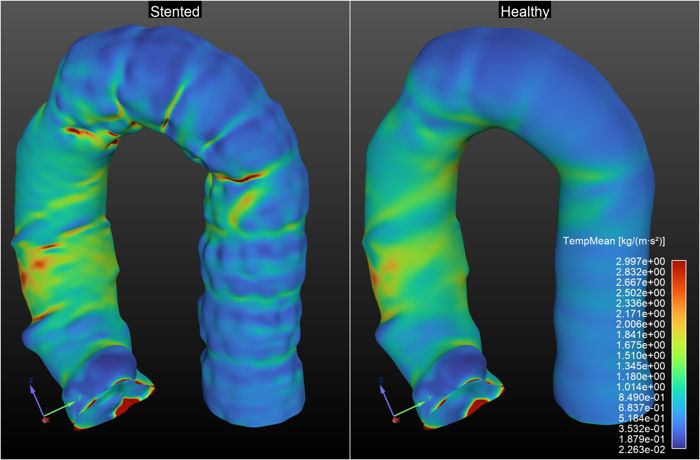
Stents are a common intervention for narrowed or damaged sections of the aorta, but placing rigid, patterned hardware inside a flexible, curved vessel changes the fluid mechanics of the blood passing through it. This project builds and compares two computational fluid dynamics (CFD) models — one of a stented aorta reconstructed from an anonymized patient MRI, and one of a "healthy" aorta created by digitally smoothing that same geometry — to see how much a stent disrupts normal flow, and where.

Methodology

The stented geometry came directly from an anonymized patient MRI, including the natural roughness of the descending aorta. The healthy geometry was derived from that same scan using Blender's smoothing tool, dragged over the stented region until a smooth, idealized artery wall remained — a modeling decision that turns out to matter later.

healthy mesh cells

344,156

healthy orthogonal quality

0.173

stented mesh cells

475,503

stented orthogonal quality

0.145

Both meshes used 10 boundary layers with a 1.2 growth rate and a poly-hexcore scheme. Each simulation modeled a full 0.7-second cardiac cycle and took roughly 60 minutes of compute time. Mesh quality could be improved in a future pass, but was sufficient for this comparative study.

Flow & stress results

Overall flow velocity through the stented and healthy geometries was comparably similar — the stent doesn't dramatically slow blood down. The real differences show up in the details: the stent's ridged geometry creates recirculation pockets, particularly through the stenosis region, that a smooth healthy vessel doesn't produce.

Zoomed-in flow field visualization of the stented aortic region, showing particle velocity and recirculation.
Zoomed flow field through the stented region — recirculation is visibly higher than in the healthy geometry
Wall shear stress visualization of the aorta over the cardiac cycle, showing high-stress regions in red at the stent location.
Wall shear stress over the cardiac cycle — the stent's ridges create repeating high-stress pockets
Time-averaged wall shear stress (TAWSS) visualization, showing the areas most likely to experience plaque buildup.
Time-averaged wall shear stress (TAWSS) — red regions are most likely to see plaque buildup over time

The Oscillatory Shear Index (OSI), which tracks how much flow direction reverses along the vessel wall, was also elevated at the stent site — another marker associated with plaque accumulation. Together, the wall shear stress, TAWSS, and OSI results point to the same conclusion: the stent's textured geometry, not just its presence, is what's driving the disrupted flow.

Discussion & model limits

Stents are an impressive piece of biomedical engineering, but this study suggests the recirculation and stress they introduce is worth continued attention — reducing those high-stress regions could meaningfully improve long-term outcomes.

The "healthy" geometry showed faint traces of the same oscillatory shear behavior seen in the stented model. That's very unlikely to be a real physiological signal — it's far more likely a modeling artifact from the Blender smoothing pass not fully removing the original stented surface pattern. Recognizing that a model's output can reflect how it was built, not just the physics it's simulating, was one of the most important takeaways from this project.

Future work worth exploring: better flow-field visualization that keeps particles closer to centerline flow instead of stalling at a zero-velocity wall, layering a hydrogel into the stent's recirculation pockets to reduce stress (with potential for drug delivery), and further study into whether these recirculation patterns behave like the "truck-bed" flow problem seen in other fluid systems.

Full slide deck

All 18 slides, including mesh diagnostics, additional flow visualizations, and full references.

Download PDF